http://www.google.com/imgres?hl=en&biw=1280&bih=662&tbm=isch&tbnid=KOtFud-PW-PoPM:&imgrefurl=http://www.physics.csbsju.edu/stats/box2.html&docid=h5haAxCZDGfAZM&imgurl=http://www.physics.csbsju.edu/stats/simple.box.defs.gif&w=364&h=370&ei=m3BOUJrrGYr48gS7uoCABg&zoom=1&iact=hc&vpx=721&vpy=167&dur=97&hovh=226&hovw=223&tx=145&ty=138&sig=104655054681110617605&page=1&tbnh=133&tbnw=132&start=0&ndsp=19&ved=1t:429,r:3,s:0,i:148
Box Plot
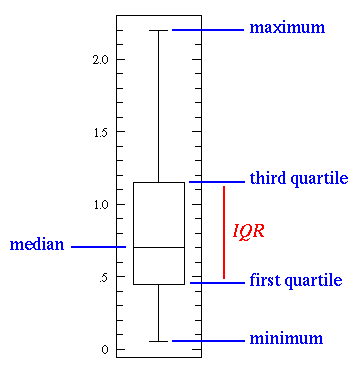
A box plot is a graphic representation of a distribution by a rectangle, the ends of which mark the maximum and minimum values, and in which the median and first and third quartiles are marked by lines parallel to the ends.
No comments:
Post a Comment