Monday, September 10, 2012

Similarity Matrix


http://www.google.com/imgres?hl=en&biw=1280&bih=662&tbm=isch&tbnid=0Fw5_jKKdxmtMM:&imgrefurl=http://www.epicentersoftware.com/genetrix/support/WebHelp/Visualization/Similarity_Matrices_and_MDS/Using_Similarity_Matrices.htm&docid=JLJrLV9NwuDTMM&imgurl=http://www.epicentersoftware.com/genetrix/support/WebHelp/SimilarityMatrix-Expressions.gif&w=714&h=507&ei=EnNOUJXpLo_g8ATvjYHYCQ&zoom=1&iact=rc&dur=358&sig=104655054681110617605&page=1&tbnh=123&tbnw=173&start=0&ndsp=18&ved=1t:429,r:9,s:0,i:128&tx=78&ty=80


Similarity Matrix


Similarity Matrix is a two-dimensional graphical display of all pair-wise distances between a set of features or samples. Distances can be calculated in a number of ways, including Euclidean distance, the square of the Euclidean distance, correlation, the absolute value of the correlation, and city block.

Stem and Leaf Plot


http://www.google.com/imgres?hl=en&biw=1280&bih=662&tbm=isch&tbnid=mWLCcttmD7eOwM:&imgrefurl=http://www.nhhealthcost.org/method.aspx&docid=nWiG695vWXWdmM&imgurl=http://www.nhhealthcost.org/i/stemLeafPlot.gif&w=451&h=260&ei=1HFOUJiCC4Ls8wTo84Fw&zoom=1&iact=hc&vpx=334&vpy=342&dur=4953&hovh=170&hovw=296&tx=212&ty=99&sig=104655054681110617605&page=1&tbnh=90&tbnw=156&start=0&ndsp=20&ved=1t:429,r:9,s:0,i:167

Stem and Leaf Plot

Stem and Leaf Plot is a device for presenting quantitative data in a graphical format, similar to a histogram, to assist in visualizing the shape of a distribution.

Box Plot


http://www.google.com/imgres?hl=en&biw=1280&bih=662&tbm=isch&tbnid=KOtFud-PW-PoPM:&imgrefurl=http://www.physics.csbsju.edu/stats/box2.html&docid=h5haAxCZDGfAZM&imgurl=http://www.physics.csbsju.edu/stats/simple.box.defs.gif&w=364&h=370&ei=m3BOUJrrGYr48gS7uoCABg&zoom=1&iact=hc&vpx=721&vpy=167&dur=97&hovh=226&hovw=223&tx=145&ty=138&sig=104655054681110617605&page=1&tbnh=133&tbnw=132&start=0&ndsp=19&ved=1t:429,r:3,s:0,i:148

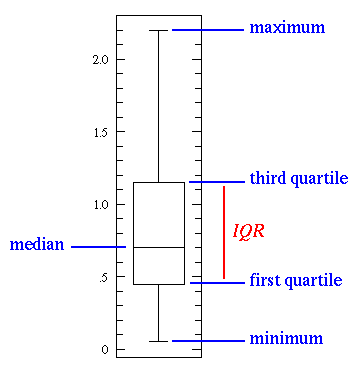
Box Plot

A box plot is a graphic representation of a distribution by a rectangle, the ends of which mark the maximum and minimum values, and in which the median and first and third quartiles are marked by lines parallel to the ends.

Histogram


http://www.google.com/imgres?hl=en&biw=1280&bih=662&tbm=isch&tbnid=9Km_4m_FBosjBM:&imgrefurl=http://www.cyber-wit.com/gallery_histogram.html&docid=FM7a_40G_VG_ZM&imgurl=http://www.cyber-wit.com/images/gallery/histogram1_b.png&w=450&h=320&ei=p29OUIuvIY2y8QTMxoGwDw&zoom=1&iact=hc&vpx=864&vpy=329&dur=1821&hovh=189&hovw=266&tx=133&ty=118&sig=104655054681110617605&page=1&tbnh=127&tbnw=179&start=0&ndsp=18&ved=1t:429,r:10,s:0,i:170

Histogram

Histogram is a bar graph of a frequency distribution in which the widths of the bars are proportional to the classes into which the variable has been divided and the heights of the bars are proportional to the class frequencies. This one shows the final score of all the students.

ParallelCoordinate Graph


http://www.google.com/imgres?num=10&hl=en&biw=1280&bih=662&tbm=isch&tbnid=yOq1sDq9UO4WCM:&imgrefurl=http://andrewgelman.com/2007/10/parallel_coordi/&docid=9eoJ2Z6UZMYHYM&imgurl=http://andrewgelman.com/movabletype/mlm/mdg1.png&w=455&h=339&ei=Pm5OUIayNYWm8ATO6IDICg&zoom=1&iact=hc&vpx=174&vpy=183&dur=7384&hovh=194&hovw=260&tx=111&ty=77&sig=104655054681110617605&page=1&tbnh=127&tbnw=171&start=0&ndsp=18&ved=1t:429,r:0,s:0,i:90

Parallel Coordinate Graph


Parallel coordinates is a common way of visualizing high-dimensional geometry and analyzing multivariate data.